Future Ready Cabonne: Increasing the Understanding
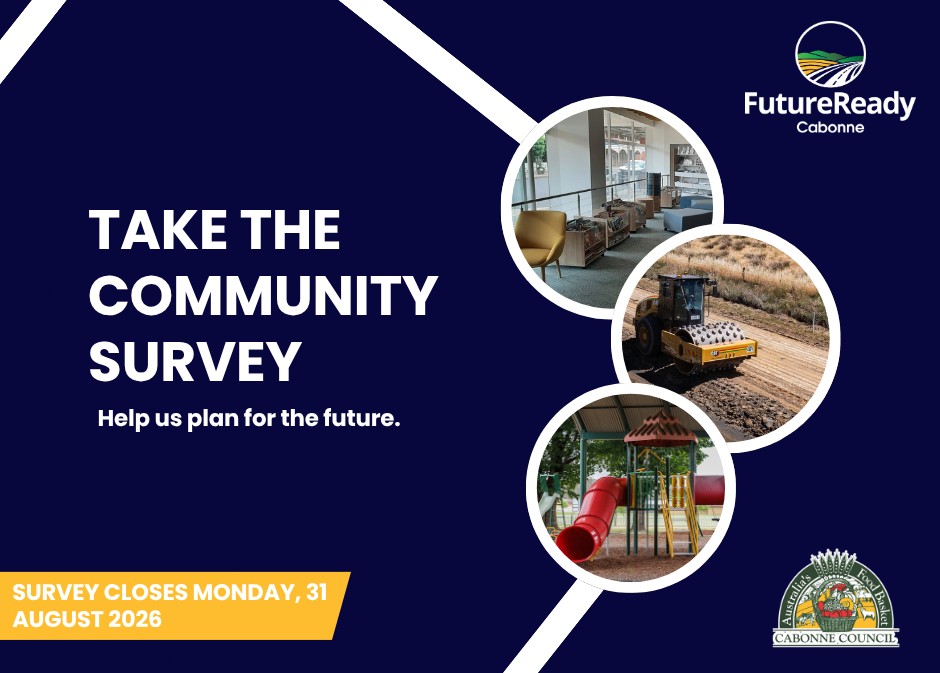
Take the Community Survey
Cabonne Council is seeking community feedback to help guide future priorities, services and spending across the Local Government Area.
Like many councils, we are facing increasing pressures from ageing infrastructure and limited resources. To ensure we can continue delivering the services and facilities our communities value most, we need to understand what is most important to you.
The survey asks residents to provide feedback on: • What Council should prioritise in the future
• Which services are most important to the community
• Areas where spending should increase, stay the same or decrease
• How Council can best shape Cabonne's future
Some of the questions involve balancing competing priorities, as resources are limited. Your feedback will help Council understand what the community values most and where future investment should be focused.
Complete the survey today and have your say on the future of Cabonne. The survey takes about 10 minutes to complete and will close on Monday, 31 August.
https://micromex.qualtrics.com/jfe/form/SV_2t6UzRi4aazrsmW?Q_CHL=qr
Council has found it increasingly difficult to achieve financial sustainability and meet the integrated Planning and Reporting (IP&R) Guidelines.
Cabonne Council, like many rural and regional councils across New South Wales and Australia, is facing a structural financial sustainability challenge that cannot be resolved through short‑term measures alone. These challenges arise from long‑standing constraints on revenue growth, increasing service delivery costs, and the ongoing responsibility to maintain a large and ageing asset base in a geographically dispersed local government area.
Council’s audited financial results for the period 2021 to 2025, together with forward modelling in the Long‑Term Financial Plan (LTFP) 2026–2036, highlight persistent operating deficits before capital grants, asset renewal investment below sustainable benchmarks, and a growing funding gap under existing rate‑pegged revenue settings. Without intervention, these trends will continue to place pressure on Council’s financial capacity and its ability to maintain services and infrastructure at acceptable and equitable levels.
Why aren't council proceeding with making a decision regarding a Special Rate Variation proposal at this point in time?
At the time of preparing the business paper for the 28 April 2026 Ordinary Council Meeting, council was acutely aware of the significant upheaval and instability currently affecting global, national, and regional economies, largely driven by conflict in the Middle East and the resulting energy market shocks. At present, it remains unclear whether these impacts will be short‑term disruptions, medium‑term economic disturbances, or longer‑term structural challenges with potentially severe consequences.
Given this context of heightened and ongoing uncertainty, council chose not to proceed with an application to the NSW IPART in 2027 and postponed making this important decision regarding a Special Rate Variation (SRV) for a further eighteen months for a potential 2028 application to the NSW IPART. While council’s financial sustainability challenges are both serious and pressing, it is critical that council ensures the community has a clear and thorough understanding of the implications of both proceeding with an SRV or alternatively if council were not to pursue any rate increase. This includes the likely impacts on council’s medium- to long-term service levels and the condition of its assets. This would likely be extremely complex and difficult at the present time with such economic uncertainty.
Extending the consultation and information sharing phase over a longer period will assist in improving community understanding of council’s financial challenges. It will also provide council with greater capacity to balance its decision making against the currently unknown medium- to long-term economic impacts of the conflict in the Middle East. This includes consideration of council’s own ability to operate, maintain, and renew assets and deliver services during this period of economic uncertainty.
Integrated Planning and Reporting 2026-2027
The Integrated Planning and Reporting (IP&R) framework is prescribed by the Local Government Act 1993. The IP&R framework allows councils to draw its various plans together, to understand how they interact and inform each other, and to get maximum benefit from their efforts by planning holistically for the future.
At the 28 April 2026 Ordinary Council Meeting, council considered the Integrated Planning and Reporting 2026-27 documents, comprising of:
- Delivery Program 2025-2029,
- Operational Plan 2026-2027 incorporating the Budget and Fees and Charges, and
- Resourcing Strategy 2026-2036 incorporating the Long-Term Financial Plan, Strategic Asset Management Plan and Strategic Service Management Plan.
The Integrated Planning and Reporting 2026-2027 documentation were placed on public exhibition for 28 days. No submissions were received during this time, and the documents were adopted at the June Ordinary Council Meeting. The documents can now be viewed under the 'documents' heading and on Council's website.
How can I have my say on the Future Ready Cabonne: Increasing the Understanding project?
Make a submission via:
- Online: Use the Future Ready Forum below.
- Email: council@cabonne.nsw.gov.au(External link)
- Post: General Manager, PO Box 17 Molong NSW 2866
Any person may make written submissions to Cabonne Council about the project.
Take the Community Survey
Cabonne Council is seeking community feedback to help guide future priorities, services and spending across the Local Government Area.
Like many councils, we are facing increasing pressures from ageing infrastructure and limited resources. To ensure we can continue delivering the services and facilities our communities value most, we need to understand what is most important to you.
The survey asks residents to provide feedback on: • What Council should prioritise in the future
• Which services are most important to the community
• Areas where spending should increase, stay the same or decrease
• How Council can best shape Cabonne's future
Some of the questions involve balancing competing priorities, as resources are limited. Your feedback will help Council understand what the community values most and where future investment should be focused.
Complete the survey today and have your say on the future of Cabonne. The survey takes about 10 minutes to complete and will close on Monday, 31 August.
https://micromex.qualtrics.com/jfe/form/SV_2t6UzRi4aazrsmW?Q_CHL=qr
Council has found it increasingly difficult to achieve financial sustainability and meet the integrated Planning and Reporting (IP&R) Guidelines.
Cabonne Council, like many rural and regional councils across New South Wales and Australia, is facing a structural financial sustainability challenge that cannot be resolved through short‑term measures alone. These challenges arise from long‑standing constraints on revenue growth, increasing service delivery costs, and the ongoing responsibility to maintain a large and ageing asset base in a geographically dispersed local government area.
Council’s audited financial results for the period 2021 to 2025, together with forward modelling in the Long‑Term Financial Plan (LTFP) 2026–2036, highlight persistent operating deficits before capital grants, asset renewal investment below sustainable benchmarks, and a growing funding gap under existing rate‑pegged revenue settings. Without intervention, these trends will continue to place pressure on Council’s financial capacity and its ability to maintain services and infrastructure at acceptable and equitable levels.
Why aren't council proceeding with making a decision regarding a Special Rate Variation proposal at this point in time?
At the time of preparing the business paper for the 28 April 2026 Ordinary Council Meeting, council was acutely aware of the significant upheaval and instability currently affecting global, national, and regional economies, largely driven by conflict in the Middle East and the resulting energy market shocks. At present, it remains unclear whether these impacts will be short‑term disruptions, medium‑term economic disturbances, or longer‑term structural challenges with potentially severe consequences.
Given this context of heightened and ongoing uncertainty, council chose not to proceed with an application to the NSW IPART in 2027 and postponed making this important decision regarding a Special Rate Variation (SRV) for a further eighteen months for a potential 2028 application to the NSW IPART. While council’s financial sustainability challenges are both serious and pressing, it is critical that council ensures the community has a clear and thorough understanding of the implications of both proceeding with an SRV or alternatively if council were not to pursue any rate increase. This includes the likely impacts on council’s medium- to long-term service levels and the condition of its assets. This would likely be extremely complex and difficult at the present time with such economic uncertainty.
Extending the consultation and information sharing phase over a longer period will assist in improving community understanding of council’s financial challenges. It will also provide council with greater capacity to balance its decision making against the currently unknown medium- to long-term economic impacts of the conflict in the Middle East. This includes consideration of council’s own ability to operate, maintain, and renew assets and deliver services during this period of economic uncertainty.
Integrated Planning and Reporting 2026-2027
The Integrated Planning and Reporting (IP&R) framework is prescribed by the Local Government Act 1993. The IP&R framework allows councils to draw its various plans together, to understand how they interact and inform each other, and to get maximum benefit from their efforts by planning holistically for the future.
At the 28 April 2026 Ordinary Council Meeting, council considered the Integrated Planning and Reporting 2026-27 documents, comprising of:
- Delivery Program 2025-2029,
- Operational Plan 2026-2027 incorporating the Budget and Fees and Charges, and
- Resourcing Strategy 2026-2036 incorporating the Long-Term Financial Plan, Strategic Asset Management Plan and Strategic Service Management Plan.
The Integrated Planning and Reporting 2026-2027 documentation were placed on public exhibition for 28 days. No submissions were received during this time, and the documents were adopted at the June Ordinary Council Meeting. The documents can now be viewed under the 'documents' heading and on Council's website.
How can I have my say on the Future Ready Cabonne: Increasing the Understanding project?
Make a submission via:
- Online: Use the Future Ready Forum below.
- Email: council@cabonne.nsw.gov.au(External link)
- Post: General Manager, PO Box 17 Molong NSW 2866
Any person may make written submissions to Cabonne Council about the project.
-
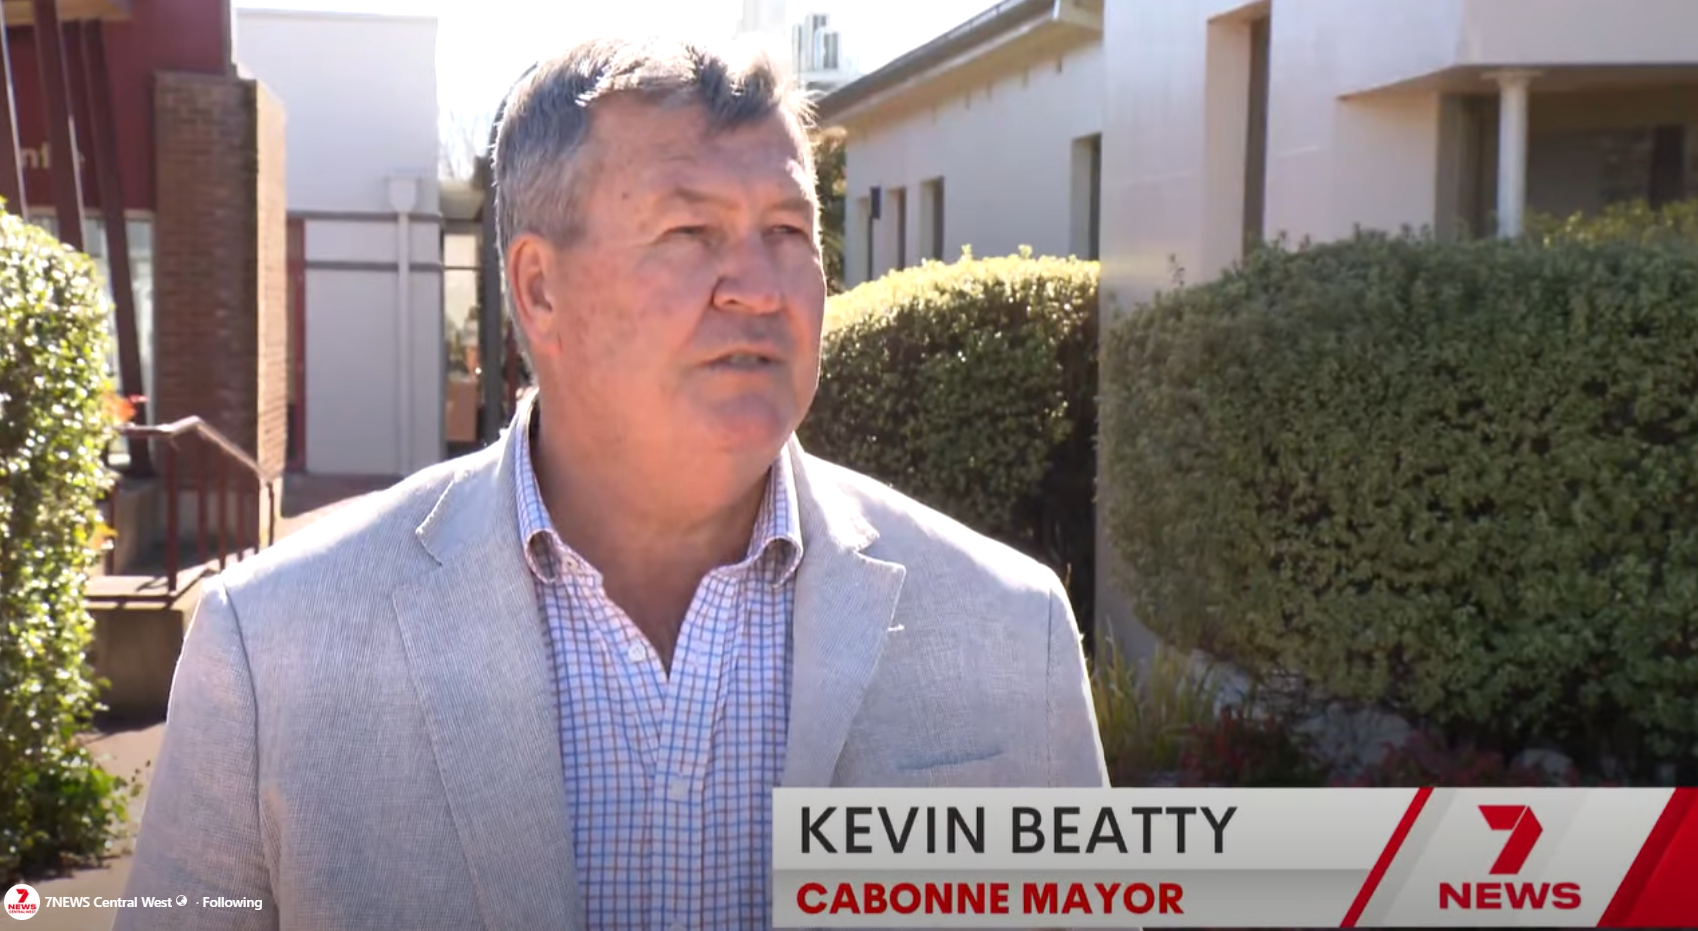
In the Media: 7News Central West - 30 April 2026
Share In the Media: 7News Central West - 30 April 2026 on Facebook Share In the Media: 7News Central West - 30 April 2026 on X (formerly Twitter) Share In the Media: 7News Central West - 30 April 2026 on Linkedin Email In the Media: 7News Central West - 30 April 2026 link -
Council delays the decision regarding a Special Rate Variation for a further eighteen months for a potential 2028 application to the NSW IPART
Share Council delays the decision regarding a Special Rate Variation for a further eighteen months for a potential 2028 application to the NSW IPART on Facebook Share Council delays the decision regarding a Special Rate Variation for a further eighteen months for a potential 2028 application to the NSW IPART on X (formerly Twitter) Share Council delays the decision regarding a Special Rate Variation for a further eighteen months for a potential 2028 application to the NSW IPART on Linkedin Email Council delays the decision regarding a Special Rate Variation for a further eighteen months for a potential 2028 application to the NSW IPART linkCouncil is facing increasing challenges in achieving long‑term financial sustainability. As part of addressing these challenges, Council has been considering whether a Special Rate Variation (SRV) may be needed in the future. Like many rural and regional councils, these pressures are driven by limited revenue growth, rising service delivery costs, and the need to maintain a large and ageing asset base.
At the 28 April 2026 Ordinary Council Meeting, Council chose to delay the decision regarding a Special Rate Variation at this time due to ongoing economic uncertainty at the global, national and regional level. Instead, Council has deferred this decision for up to 18 months. This will allow additional time to better understand potential economic impacts and to ensure the community is fully informed about the implications of both pursuing or not pursuing an SRV.
To support community understanding, Council will also be releasing a series of factual videos explaining Council’s finances and how they operate. These will help provide greater transparency around the financial pressures Council faces and the choices involved in long‑term financial planning.
For more information, to stay connected or to register for updates, visit: Future Ready Cabonne - Have Your Say
Council is facing increasing challenges in achieving long‑term financial sustainability. As part of addressing these challenges, Council has been considering whether a Special Rate Variation (SRV) may be needed in the future. Like many rural and regional councils, these pressures are driven by limited revenue growth, rising service delivery costs, and the need to maintain a large and ageing asset base.
At the 28 April 2026 Ordinary Council Meeting, Council chose to delay the decision regarding a Special Rate Variation at this time due to ongoing economic uncertainty at the global, national and regional level. Instead, Council has deferred this decision for up to 18 months. This will allow additional time to better understand potential economic impacts and to ensure the community is fully informed about the implications of both pursuing or not pursuing an SRV.
To support community understanding, Council will also be releasing a series of factual videos explaining Council’s finances and how they operate. These will help provide greater transparency around the financial pressures Council faces and the choices involved in long‑term financial planning.
For more information, to stay connected or to register for updates, visit: Future Ready Cabonne - Have Your Say
-
Progress update - Farmland Category application review
Share Progress update - Farmland Category application review on Facebook Share Progress update - Farmland Category application review on X (formerly Twitter) Share Progress update - Farmland Category application review on Linkedin Email Progress update - Farmland Category application review linkInitial Mail‑out
- 1,966 letters issued in November 2025
- Due date was 3 February 2026
- 788 pplication forms returned from mail‑out
- 54 additional applications received
- 842 applications completed in total
- 40.1% response rate to mail-out
- Overall applications vs mail‑out: 42.8%
A second reminder letter was issued on 12 February 2026, with a due date of 20 March 2026.As at 8 April 2026, a total of 1,418 farmland application forms have been submitted to council. This is an overall 72% response rate.
Council continues to receive completed forms and will assess as they are received.
Next Steps
- Collate and validate all responses from the second mail‑out.
- Identify non‑responding ratepayers and prioritise reviews based on risk and property characteristics.
- Undertake desktop assessments using mapping, valuation, and historical land‑use data.
- Contact landholders where further information or clarification is required.
- Conduct on‑farm assessments for higher‑risk or unclear cases.
- Escalate complex cases for peer review where necessary; and
- Finalise classifications and update rating records.
Initial Mail‑out
- 1,966 letters issued in November 2025
- Due date was 3 February 2026
- 788 pplication forms returned from mail‑out
- 54 additional applications received
- 842 applications completed in total
- 40.1% response rate to mail-out
- Overall applications vs mail‑out: 42.8%
A second reminder letter was issued on 12 February 2026, with a due date of 20 March 2026.As at 8 April 2026, a total of 1,418 farmland application forms have been submitted to council. This is an overall 72% response rate.
Council continues to receive completed forms and will assess as they are received.
Next Steps
- Collate and validate all responses from the second mail‑out.
- Identify non‑responding ratepayers and prioritise reviews based on risk and property characteristics.
- Undertake desktop assessments using mapping, valuation, and historical land‑use data.
- Contact landholders where further information or clarification is required.
- Conduct on‑farm assessments for higher‑risk or unclear cases.
- Escalate complex cases for peer review where necessary; and
- Finalise classifications and update rating records.
-
Review of Council's Rating System
Share Review of Council's Rating System on Facebook Share Review of Council's Rating System on X (formerly Twitter) Share Review of Council's Rating System on Linkedin Email Review of Council's Rating System linkIn May 2025, Future Together Group provided council with a Rating Review Technical Report to inform future consideration of council’s rating framework. The report represents the first broad review of council’s rating structure since amalgamation in 1977 and was prepared to identify potential equity, governance, and financial sustainability issues.
The Rating Review Technical Report does not constitute an adopted council position. Further internal analysis, data validation, community engagement, and council consideration are underway and will be required before any recommendations are progressed.
The current farmland category review is being undertaken as a stand‑alone compliance and data integrity exercise. It is not the implementation of the report’s broader rating model and does not result in rate increases beyond the approved rate peg.
Council is required under the Local Government Act 1993 (NSW) to ensure that land within the Local Government Area is categorised correctly for rating purposes based on its dominant use. Over time, land use can change due to development, changes in business activity, lifestyle transitions, or the cessation of agricultural operations. Where rating categories are not reviewed periodically, there is an increased risk that properties may no longer be rated in a manner that accurately reflects their current use.
The review process involves assessing existing land categorisations, examining land use and valuation data, and ensuring legislative alignment. This supports an equitable distribution of the rating burden, strengthens governance assurance, and contributes to long‑term financial sustainability
The report identified several issues for council’s consideration, including:
- The current use of minimum rating and ad-valorem particularly within Residential and Business categories, may contribute to inequitable outcomes between ratepayers.
- Historic land categorisation practices increase the risk that some properties may no longer align with legislative rating definitions based on dominant land use.
- Within the Farmland category, some assessments may not meet the legislative test for genuine commercial farming activity, resulting in potential cross‑subsidisation by productive agricultural operations.
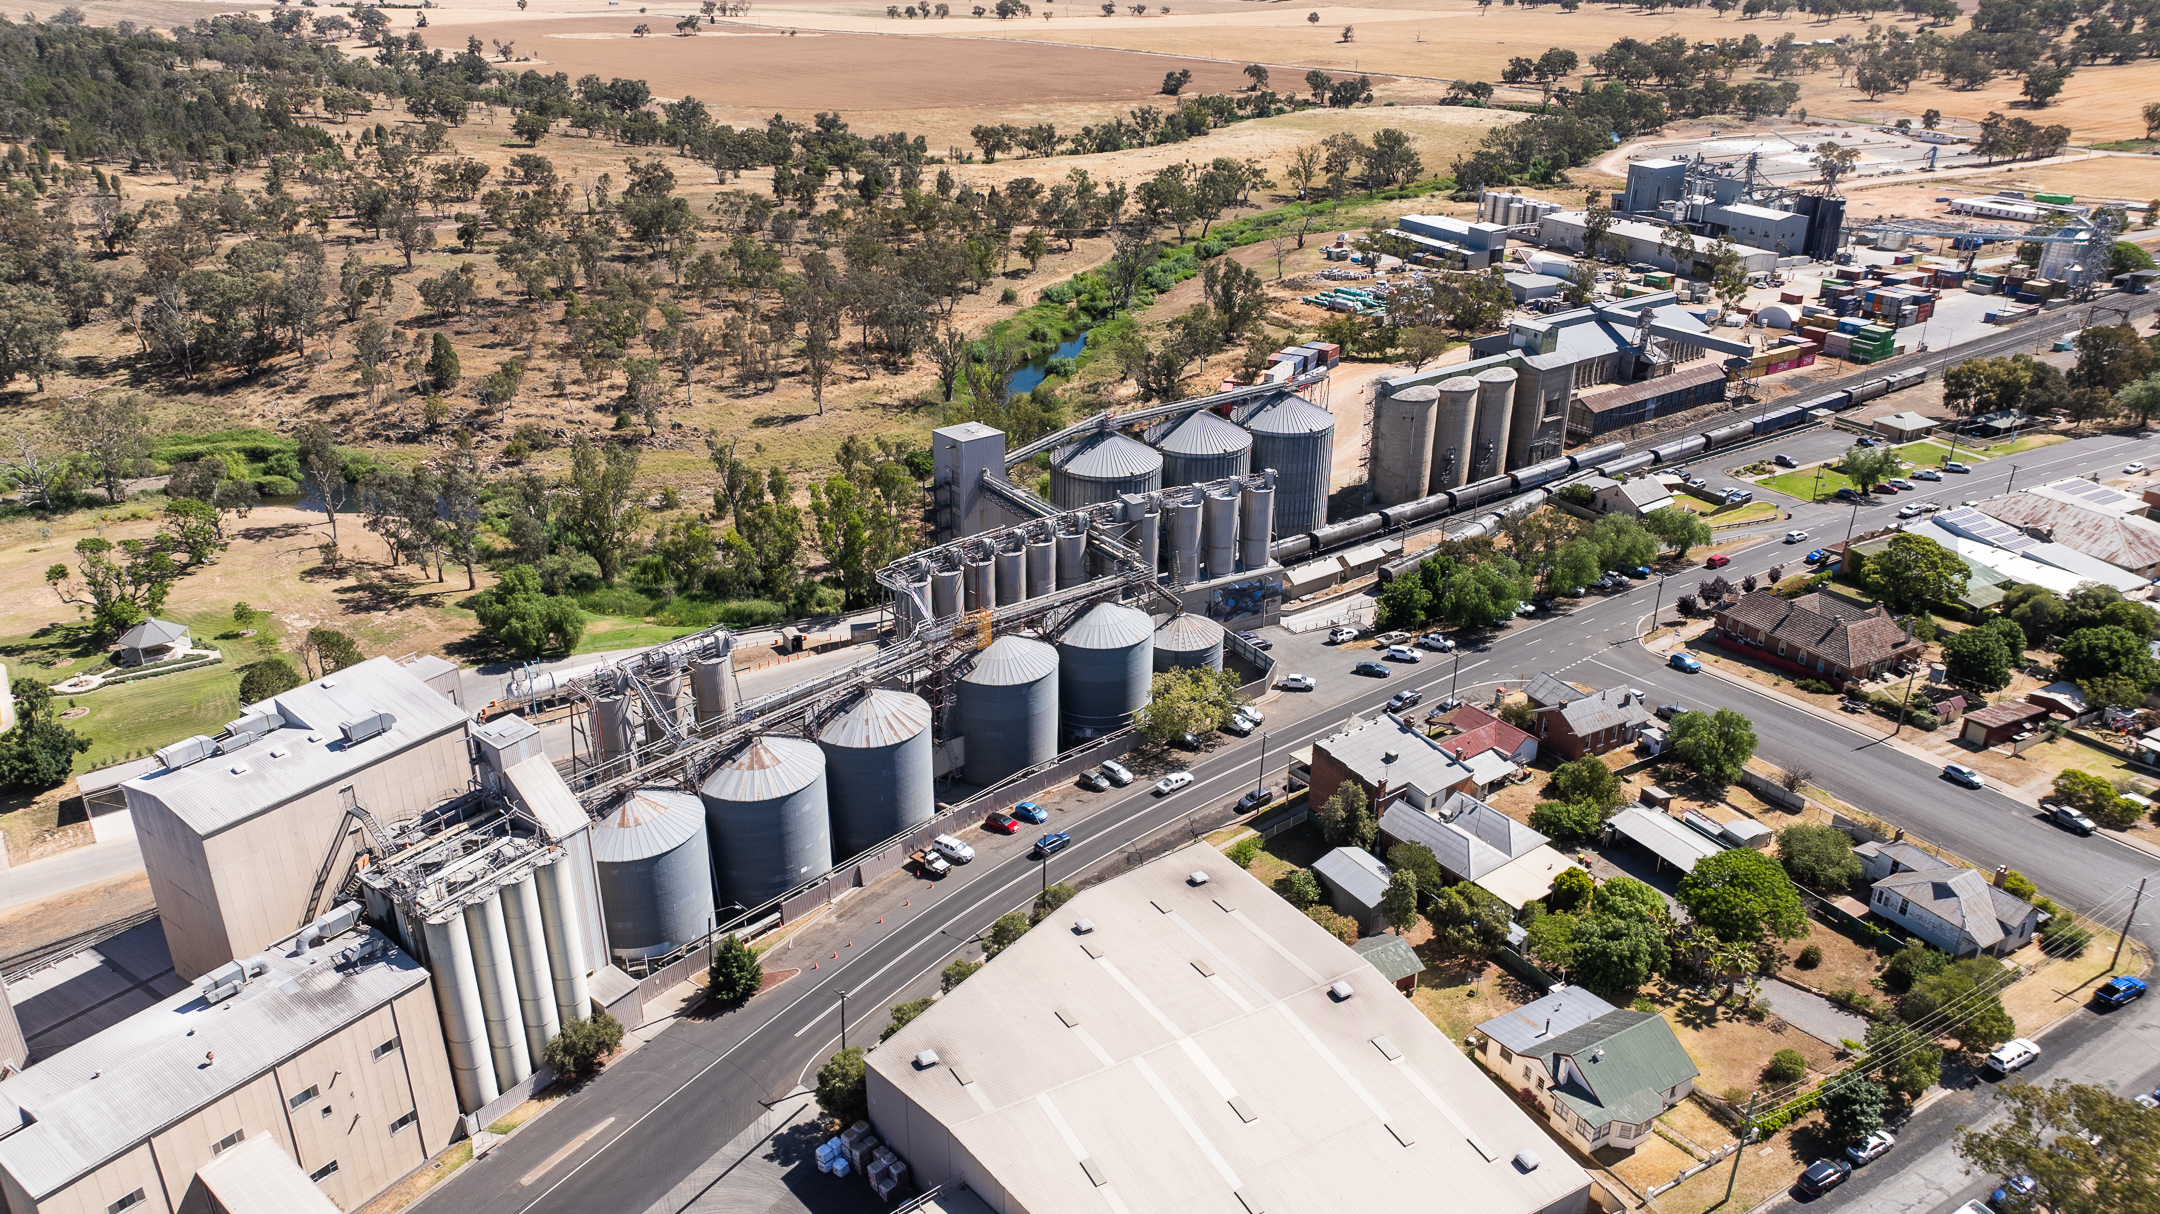
- Certain land uses, particularly quarrying and large‑scale agricultural milling and processing, may have a disproportionate impact on council infrastructure that is not fully reflected in current rating structures.
These matters were identified to inform further analysis rather than to recommend immediate structural change.
What is the difference between Minimum, Ad Valorem and Base Rating?
Under the Local Government Act 1993, councils may apply ordinary rates using either a minimum rate or a base rate, alongside an ad valorem component. The difference between these components is detailed below.

The Rating Review Technical Report suggests that greater reliance on base rates and ad valorem components, rather than minimum rates, may improve transparency and equity within and between rating categories. Any consideration of changes to rating methodology would require detailed financial modelling, community consultation, and formal council approval.
Council Rating Categories
Council’s current rating categories, determined in accordance with the Local Government Act 1993 (NSW), are as follows:
- Farmland
- Residential
- Residential – Canowindra
- Business
- Business – Canowindra
- Mining
Potential Rating Sub‑Categories Under Review
As part of the broader rating category review, council is assessing whether additional sub‑categories may be required to more accurately reflect dominant land use in accordance with the relevant provisions of the Local Government Act 1993. These matters remain under review, and no decisions have been made.
Category / Sub‑Category
Legislative Reference
Farmland
Section 515
Farmland – Low Intensity
Section 515
Residential
Section 516(1)
Rural Residential
Section 515(2)
Business
Section 518
Business – Quarrying
Section 518
Business – Agricultural Milling
Section 518
Mining
Section 517(1)
These potential sub‑categories are being examined to support compliance, equity, and transparency within council’s rating framework. Any future changes would be subject to further analysis, stakeholder engagement, and formal council approval in accordance with legislative requirements.
Consultation
Consistent with principles of good governance and informed decision‑making, initial consultation has occurred with identified Business - Agricultural Milling ratepayers referenced in the report. This consultation was undertaken to:
- Seek factual feedback on operational characteristics.
- Improve council’s understanding of land use and infrastructure impacts; and
- Inform internal analysis and future consideration.
This engagement does not imply endorsement of the report’s analysis or recommendations, and no decisions have been made regarding rating outcomes, category structures, or future rate impacts.
Linkage to the Long‑Term Financial Plan
The Rating Review Technical Report was prepared to assist council in future deliberations relating to its Revenue Policy and Long‑Term Financial Plan. Any changes to rating structures, rating mixes, or category incidence would need to be considered through council’s Integrated Planning and Reporting framework, including affordability, intergenerational equity, and service level impacts.
The current rating category review does not increase council’s overall rate revenue beyond the approved rate peg, does not pre‑empt any Special Rate Variation decisions, and does not commit council to implementing the report’s recommendations. Instead, it is intended to strengthen the accuracy and integrity of council’s rating data, supporting more reliable long‑term financial modelling.
Consideration of Additional Farmland Sub-Category
Farmland – Low Intensity
The establishment of a Farmland subcategory is necessary to ensure the appropriate rating of vacant land zoned for agricultural purposes in accordance with the Local Government Act.
Section 519 requires vacant land to be categorised based on its permitted use or surrounding development, meaning parcels zoned solely for farming, or surrounded by farmland, must be categorised as farmland regardless of vacancy or the submission of a farmland application.
Guidance in the Rating and Revenue Raising Manual reinforces that vacant land should not be arbitrarily categorised and that zoning provides a clear basis for farmland classification.
Introducing a Farmland subcategory also enables council to differentiate between genuine farming land and lower‑intensity or vacant agricultural land, allowing higher ad valorem rates to be applied where appropriate. Consistent with section 529(2)(a), this distinction would be based on intensity of use, with the preferred approach being a dominant-use farming category supported by a Farmland – Low Intensity subcategory.
In May 2025, Future Together Group provided council with a Rating Review Technical Report to inform future consideration of council’s rating framework. The report represents the first broad review of council’s rating structure since amalgamation in 1977 and was prepared to identify potential equity, governance, and financial sustainability issues.
The Rating Review Technical Report does not constitute an adopted council position. Further internal analysis, data validation, community engagement, and council consideration are underway and will be required before any recommendations are progressed.
The current farmland category review is being undertaken as a stand‑alone compliance and data integrity exercise. It is not the implementation of the report’s broader rating model and does not result in rate increases beyond the approved rate peg.
Council is required under the Local Government Act 1993 (NSW) to ensure that land within the Local Government Area is categorised correctly for rating purposes based on its dominant use. Over time, land use can change due to development, changes in business activity, lifestyle transitions, or the cessation of agricultural operations. Where rating categories are not reviewed periodically, there is an increased risk that properties may no longer be rated in a manner that accurately reflects their current use.
The review process involves assessing existing land categorisations, examining land use and valuation data, and ensuring legislative alignment. This supports an equitable distribution of the rating burden, strengthens governance assurance, and contributes to long‑term financial sustainability
The report identified several issues for council’s consideration, including:
- The current use of minimum rating and ad-valorem particularly within Residential and Business categories, may contribute to inequitable outcomes between ratepayers.
- Historic land categorisation practices increase the risk that some properties may no longer align with legislative rating definitions based on dominant land use.
- Within the Farmland category, some assessments may not meet the legislative test for genuine commercial farming activity, resulting in potential cross‑subsidisation by productive agricultural operations.
- Certain land uses, particularly quarrying and large‑scale agricultural milling and processing, may have a disproportionate impact on council infrastructure that is not fully reflected in current rating structures.
These matters were identified to inform further analysis rather than to recommend immediate structural change.
What is the difference between Minimum, Ad Valorem and Base Rating?
Under the Local Government Act 1993, councils may apply ordinary rates using either a minimum rate or a base rate, alongside an ad valorem component. The difference between these components is detailed below.

The Rating Review Technical Report suggests that greater reliance on base rates and ad valorem components, rather than minimum rates, may improve transparency and equity within and between rating categories. Any consideration of changes to rating methodology would require detailed financial modelling, community consultation, and formal council approval.
Council Rating Categories
Council’s current rating categories, determined in accordance with the Local Government Act 1993 (NSW), are as follows:
- Farmland
- Residential
- Residential – Canowindra
- Business
- Business – Canowindra
- Mining
Potential Rating Sub‑Categories Under Review
As part of the broader rating category review, council is assessing whether additional sub‑categories may be required to more accurately reflect dominant land use in accordance with the relevant provisions of the Local Government Act 1993. These matters remain under review, and no decisions have been made.
Category / Sub‑Category
Legislative Reference
Farmland
Section 515
Farmland – Low Intensity
Section 515
Residential
Section 516(1)
Rural Residential
Section 515(2)
Business
Section 518
Business – Quarrying
Section 518
Business – Agricultural Milling
Section 518
Mining
Section 517(1)
These potential sub‑categories are being examined to support compliance, equity, and transparency within council’s rating framework. Any future changes would be subject to further analysis, stakeholder engagement, and formal council approval in accordance with legislative requirements.
Consultation
Consistent with principles of good governance and informed decision‑making, initial consultation has occurred with identified Business - Agricultural Milling ratepayers referenced in the report. This consultation was undertaken to:
- Seek factual feedback on operational characteristics.
- Improve council’s understanding of land use and infrastructure impacts; and
- Inform internal analysis and future consideration.
This engagement does not imply endorsement of the report’s analysis or recommendations, and no decisions have been made regarding rating outcomes, category structures, or future rate impacts.
Linkage to the Long‑Term Financial Plan
The Rating Review Technical Report was prepared to assist council in future deliberations relating to its Revenue Policy and Long‑Term Financial Plan. Any changes to rating structures, rating mixes, or category incidence would need to be considered through council’s Integrated Planning and Reporting framework, including affordability, intergenerational equity, and service level impacts.
The current rating category review does not increase council’s overall rate revenue beyond the approved rate peg, does not pre‑empt any Special Rate Variation decisions, and does not commit council to implementing the report’s recommendations. Instead, it is intended to strengthen the accuracy and integrity of council’s rating data, supporting more reliable long‑term financial modelling.
Consideration of Additional Farmland Sub-Category
Farmland – Low Intensity
The establishment of a Farmland subcategory is necessary to ensure the appropriate rating of vacant land zoned for agricultural purposes in accordance with the Local Government Act.
Section 519 requires vacant land to be categorised based on its permitted use or surrounding development, meaning parcels zoned solely for farming, or surrounded by farmland, must be categorised as farmland regardless of vacancy or the submission of a farmland application.
Guidance in the Rating and Revenue Raising Manual reinforces that vacant land should not be arbitrarily categorised and that zoning provides a clear basis for farmland classification.
Introducing a Farmland subcategory also enables council to differentiate between genuine farming land and lower‑intensity or vacant agricultural land, allowing higher ad valorem rates to be applied where appropriate. Consistent with section 529(2)(a), this distinction would be based on intensity of use, with the preferred approach being a dominant-use farming category supported by a Farmland – Low Intensity subcategory.
-
Budget 2026-2027
Share Budget 2026-2027 on Facebook Share Budget 2026-2027 on X (formerly Twitter) Share Budget 2026-2027 on Linkedin Email Budget 2026-2027 linkCouncil’s 2026–2027 Budget forecasts a consolidated operating surplus of $6.68 million, inclusive of capital grant income. Excluding capital grants and contributions, the budget delivers an underlying operating deficit of $7.21 million.
The budget also provides for $30.30 million in capital works, with more than $17.00 million allocated to transport infrastructure, reflecting council’s continued investment in roads and related assets.
Efficiency measures were delivered through a structured review and savings framework, with a clear emphasis on identifying sustainable and repeatable savings, rather than one-off reductions. As a result, $837,000 of current savings and $314,000 in one-off savings have been incorporated into the 2026–2027 Budget.
2026/27 Cash Budget Summary
Cash Budget Deficit
$70,000
Operational Income
$43,943,995
Operational Expenditure
(Excluding Depreciation. To support council services)
$34,446,849
Capital Expenditure
(A capital works program which funds roads, infrastructure, plant, water, sewer and innovation and technology & capital loan repayments)$30,630,726
Cash Movement from Reserves
$3,273,579
Key projects being delivered in the 2026/2027 financial year include:
Project
Project Budget
Peak Hill Road – continuation of projects funded under Roads of Strategic Importance
$10,000,000
Roads to Recovery Program
$2,200,000
Strategic Land Development – Eugowra
$2,100,000
Local Roads – Urban Reseal Program
$1,200,000
Local Roads – Heavy Patching
$1,200,000
Safer Roads Program – Yeoval Roundabout
$1,100,000
Regional Road Heavy Patching & Reseal
$900,000
Canowindra Riverwalk Project
$300,000
Go FOGO (Food Organics Garden Organics)
$264,000
Sewer Renewals
$260,000
Banjo Patterson Way – Developer Contributions
$155,000
Footpath Construction
$100,000
Fire Compliance – Caravan Parks
$97,950
Other Budget Highlights
The budget, together with the Long Term Financial Plan (LTFP), continues to highlight the challenges associated with council’s ongoing net operating results (deficits) before capital grants and contributions.
Across council’s General and Water Funds, operating deficits are forecast to increase over time unless corrective action is taken.
The General Fund is assessed as financially unsustainable in the medium term. After meeting operating costs, insufficient funding is available to fully address the required renewal of infrastructure assets. This shortfall contributes to a growing backlog of assets requiring repair or replacement.
The Water Fund is forecasting a substantial operating deficit, which is not sustainable in the medium or longer term and will require intervention to restore financial viability.
In contrast, an operating surplus is forecast in the Sewer Fund, indicating a sustainable financial position and the capacity to meet ongoing operational and asset renewal requirements.
Council’s 2026–2027 Budget forecasts a consolidated operating surplus of $6.68 million, inclusive of capital grant income. Excluding capital grants and contributions, the budget delivers an underlying operating deficit of $7.21 million.
The budget also provides for $30.30 million in capital works, with more than $17.00 million allocated to transport infrastructure, reflecting council’s continued investment in roads and related assets.
Efficiency measures were delivered through a structured review and savings framework, with a clear emphasis on identifying sustainable and repeatable savings, rather than one-off reductions. As a result, $837,000 of current savings and $314,000 in one-off savings have been incorporated into the 2026–2027 Budget.
2026/27 Cash Budget Summary
Cash Budget Deficit
$70,000
Operational Income
$43,943,995
Operational Expenditure
(Excluding Depreciation. To support council services)
$34,446,849
Capital Expenditure
(A capital works program which funds roads, infrastructure, plant, water, sewer and innovation and technology & capital loan repayments)$30,630,726
Cash Movement from Reserves
$3,273,579
Key projects being delivered in the 2026/2027 financial year include:
Project
Project Budget
Peak Hill Road – continuation of projects funded under Roads of Strategic Importance
$10,000,000
Roads to Recovery Program
$2,200,000
Strategic Land Development – Eugowra
$2,100,000
Local Roads – Urban Reseal Program
$1,200,000
Local Roads – Heavy Patching
$1,200,000
Safer Roads Program – Yeoval Roundabout
$1,100,000
Regional Road Heavy Patching & Reseal
$900,000
Canowindra Riverwalk Project
$300,000
Go FOGO (Food Organics Garden Organics)
$264,000
Sewer Renewals
$260,000
Banjo Patterson Way – Developer Contributions
$155,000
Footpath Construction
$100,000
Fire Compliance – Caravan Parks
$97,950
Other Budget Highlights
The budget, together with the Long Term Financial Plan (LTFP), continues to highlight the challenges associated with council’s ongoing net operating results (deficits) before capital grants and contributions.
Across council’s General and Water Funds, operating deficits are forecast to increase over time unless corrective action is taken.
The General Fund is assessed as financially unsustainable in the medium term. After meeting operating costs, insufficient funding is available to fully address the required renewal of infrastructure assets. This shortfall contributes to a growing backlog of assets requiring repair or replacement.
The Water Fund is forecasting a substantial operating deficit, which is not sustainable in the medium or longer term and will require intervention to restore financial viability.
In contrast, an operating surplus is forecast in the Sewer Fund, indicating a sustainable financial position and the capacity to meet ongoing operational and asset renewal requirements.
-
Long Term Financial Plan 2026-2036
Share Long Term Financial Plan 2026-2036 on Facebook Share Long Term Financial Plan 2026-2036 on X (formerly Twitter) Share Long Term Financial Plan 2026-2036 on Linkedin Email Long Term Financial Plan 2026-2036 linkThe revised Long Term Financial Plan 2026-2036 (LTFP) provides a 10-year forecast incorporating updated economic conditions, new strategic asset management information, reprioritised capital works, population growth forecasts and a program of efficiency measures. This provides various results and performance indicators in relation to council’s financial sustainability, which is the degree to which revenues can meet commitments to operations, services and infrastructure.
Council’s financial structure is divided into three separate funds: General, Water and Sewer. Within the General Fund, council operates its Domestic Waste operations, which like the three funds, are subject to legislative restrictions and subsidisation between funds is not permitted. They operate as separate businesses with appropriate inter-entry charging where required to ensure full and accurate cost absorption.
The LTFP is presented using three of the main statements provided in the annual financial reports:
- Income Statement – this statement shows the operating result and change in net assets from the operations for the year.
- Balance Sheet – this discloses the assets, liabilities and equity of council.
- Cash Flow Statement – this statement presents the cash flows associated with council’s operating, financing and investing activities.
In preparing council’s LTFP, the following principles have been adopted. council will:
- Maintain a cash balance that can meet short-term commitments,
- Maintain service levels to the community as defined in the Community Strategic Plan,
- Maintain sufficient reserves for identified commitments,
- Review operating expenditure and improve efficiency,
- Pursue cost recovery on fees for services where possible, and
- Maximise investment returns within statutory guidelines.
Council has several policies in place that support these principles, which are outlines in the Annual Operational Plan each year. The main focus of these principles is financial sustainability.
A financially sustainable council is one that has the ability to fund ongoing service delivery and the renewal and replacement of assets, while ensuring sustainable funding sources. A key indicator for this is the net operating result before capital grants and contributions which can be found in the final line of the Income Statement. This shows the degree to which operating revenues can cover commitments for operating costs and asset renewals. A focus on achieving a positive or surplus result will enable council to adopt capital programs and asset management plans, sustainable organisational structures and annual budgets within a prudent long-term financial framework. Longer term economic modelling is critical to the success of meeting the needs of the community it services. The updated LTFP is a key component of council’s financial sustainability journey and responds to:
- Persistent structural deficits
- Escalating infrastructure renewal demands, especially for roads and the transport infrastructure programs
- The latest Asset Management Plans
- Increased depreciation following asset revaluations
- High labour, materials and construction cost inflation
- Reduced predictability of capital grants
- Community expectations for improvements in road condition and maintenance
- Rate peg increase set by IPART is consistently below actual cost increases
- The continues costs and recovery work since the significant damage of the 2021-22 flood events
Long Term Financial Plan Scenarios
Council has developed four scenarios that are relevant to its current financial position. These scenarios are:
- “Base Case” Scenario.
- “Financial Improvement” Scenario with a 4-year permanent Special Variation to general rates from 1 July 2027.
- “Financial Stabilisation” Scenario with a 4-year permanent Special Variation to general rates from 1 July 2027.
- “Financially Sustainable” Scenario with a 4-year permanent Special Variation to general rates from 1 July 2027.

Council also delivers Domestic Waste services through its General Fund. Revenues for Domestic Waste must be spent on Domestic Waste services, therefore, for the purposes of this LTFP, Domestic Waste has been treated as though it is entirely separate from the General Fund. This allows for a more unfiltered view of the financial sustainability of council’s day-to-day operations and infrastructure.
All three scenarios focus on the sustainability of the General Fund, which is the fund that covers the majority of the services and infrastructure that council provides. General rates are the primary source of revenue for General Fund Operations. Council does receive income from other sources, such as fees and charges, grants and contributions and investments. It also uses borrowings to fund specific General Fund projects.
Water, Sewer and Domestic Waste operations are forecast to continue as they are currently run, in line with the general assumptions provided for all three scenarios.
As the scenarios focus on the health and sustainability of the General Fund, forecasted statements and ratios will be reported in this LTFP for both the General Fund and the consolidated organisation.
The revised Long Term Financial Plan 2026-2036 (LTFP) provides a 10-year forecast incorporating updated economic conditions, new strategic asset management information, reprioritised capital works, population growth forecasts and a program of efficiency measures. This provides various results and performance indicators in relation to council’s financial sustainability, which is the degree to which revenues can meet commitments to operations, services and infrastructure.
Council’s financial structure is divided into three separate funds: General, Water and Sewer. Within the General Fund, council operates its Domestic Waste operations, which like the three funds, are subject to legislative restrictions and subsidisation between funds is not permitted. They operate as separate businesses with appropriate inter-entry charging where required to ensure full and accurate cost absorption.
The LTFP is presented using three of the main statements provided in the annual financial reports:
- Income Statement – this statement shows the operating result and change in net assets from the operations for the year.
- Balance Sheet – this discloses the assets, liabilities and equity of council.
- Cash Flow Statement – this statement presents the cash flows associated with council’s operating, financing and investing activities.
In preparing council’s LTFP, the following principles have been adopted. council will:
- Maintain a cash balance that can meet short-term commitments,
- Maintain service levels to the community as defined in the Community Strategic Plan,
- Maintain sufficient reserves for identified commitments,
- Review operating expenditure and improve efficiency,
- Pursue cost recovery on fees for services where possible, and
- Maximise investment returns within statutory guidelines.
Council has several policies in place that support these principles, which are outlines in the Annual Operational Plan each year. The main focus of these principles is financial sustainability.
A financially sustainable council is one that has the ability to fund ongoing service delivery and the renewal and replacement of assets, while ensuring sustainable funding sources. A key indicator for this is the net operating result before capital grants and contributions which can be found in the final line of the Income Statement. This shows the degree to which operating revenues can cover commitments for operating costs and asset renewals. A focus on achieving a positive or surplus result will enable council to adopt capital programs and asset management plans, sustainable organisational structures and annual budgets within a prudent long-term financial framework. Longer term economic modelling is critical to the success of meeting the needs of the community it services. The updated LTFP is a key component of council’s financial sustainability journey and responds to:
- Persistent structural deficits
- Escalating infrastructure renewal demands, especially for roads and the transport infrastructure programs
- The latest Asset Management Plans
- Increased depreciation following asset revaluations
- High labour, materials and construction cost inflation
- Reduced predictability of capital grants
- Community expectations for improvements in road condition and maintenance
- Rate peg increase set by IPART is consistently below actual cost increases
- The continues costs and recovery work since the significant damage of the 2021-22 flood events
Long Term Financial Plan Scenarios
Council has developed four scenarios that are relevant to its current financial position. These scenarios are:
- “Base Case” Scenario.
- “Financial Improvement” Scenario with a 4-year permanent Special Variation to general rates from 1 July 2027.
- “Financial Stabilisation” Scenario with a 4-year permanent Special Variation to general rates from 1 July 2027.
- “Financially Sustainable” Scenario with a 4-year permanent Special Variation to general rates from 1 July 2027.

Council also delivers Domestic Waste services through its General Fund. Revenues for Domestic Waste must be spent on Domestic Waste services, therefore, for the purposes of this LTFP, Domestic Waste has been treated as though it is entirely separate from the General Fund. This allows for a more unfiltered view of the financial sustainability of council’s day-to-day operations and infrastructure.
All three scenarios focus on the sustainability of the General Fund, which is the fund that covers the majority of the services and infrastructure that council provides. General rates are the primary source of revenue for General Fund Operations. Council does receive income from other sources, such as fees and charges, grants and contributions and investments. It also uses borrowings to fund specific General Fund projects.
Water, Sewer and Domestic Waste operations are forecast to continue as they are currently run, in line with the general assumptions provided for all three scenarios.
As the scenarios focus on the health and sustainability of the General Fund, forecasted statements and ratios will be reported in this LTFP for both the General Fund and the consolidated organisation.
-
Strategic Asset Management Plan 2026-2036
Share Strategic Asset Management Plan 2026-2036 on Facebook Share Strategic Asset Management Plan 2026-2036 on X (formerly Twitter) Share Strategic Asset Management Plan 2026-2036 on Linkedin Email Strategic Asset Management Plan 2026-2036 linkThis Strategic Asset Management Plan 2026-2036 (SAMP) sits alongside the Long Term Financial Plan (LTFP) in Council’s Resourcing Strategy. Its purpose is to communicate the implications of the current course of action (which is described as the base case scenario) and to explore alternative scenarios which involve investing more resources to reduce the risk.
This SAMP is best understood, as a key part of both Council’s Integrated Planning and Reporting (IP&R) and Risk Management (RM) Frameworks. It is a Risk Treatment Plan for Council’s infrastructure assets, although many of the activities to treat risk are unfunded in the base case scenario, which is why council is exploring alternatives.
Summary of our assets
Council manages an asset portfolio of $925.327M. The responsible and sustainable investment in these physical assets is crucial to the sound financial management of council's organisation itself but also, more broadly, for the benefit of our local communities.
Annually, the financial investment towards the management of this portfolio totals $22.685M operational and $28.317M capital expenditure, totalling $51.002M. This budgeted expenditure is utilised to deliver the objectives set in Council's Delivery Program, summarised as follows:
Function
Objective
Transport Infrastructure
Safe, smooth, accessible and efficient transport infrastructure
Flooding & Drainage
Floodplain and drainage infrastructure are managed for resilience and reliability
Community Amenity & Recreation
Well maintained community & recreational facilities that cater to our needs and make it a great place to live
Plant & Depots
Modern, reliable and efficient fleet and vehicles with functional works depots
Water Supply
A safe, secure and reliable water supply
Sewerage
A sufficient and reliable sewerage system that minimises environmental impacts
What does this SAMP do?
The SAMP provides a framework for prioritisation of the available resources to deliver the best possible value from all assets under council's control, with value understood in terms of realising the objectives in the Delivery Program. This value is achieved through consideration of risks that may prevent council from reaching its objectives, as well as the financial forecasts required to deliver the services into the future.
With a direct linkage to the Long Term Financial Plan, the SAMP forecasts on the current course of action where we will be in the long term. In the case where the SAMP indicates that council may not be in a position currently to deliver on its objectives in the long term, scenarios are modelled to demonstrate how a more sustainable management of assets may be achieved.
What does the SAMP tell us?
The draft Strategic Asset Management Plan (2026-2036) indicates that the following functions are at a high risk of council not meeting its objectives over the next ten years:
- Transport Infrastructure
- Flooding and Drainage
- Water Supply
- Sewerage
This assessment is primarily made on the basis that the funding needs for each of these functions is greater than the forecasted available funding within the long term financial plan, on a "continue as we are" scenario (base case). On the basis of this risk assessment, council would continue to prioritise the limited resources it had, but it is expected that a gap would emerge between what council was trying to achieve with the service, and the reality of a declining condition and thus performance of the assets.
To provide an indication of differing levels of asset management sustainability within council's general fund, three further scenarios have been explored within the SAMP:
Financial Improvement
Function
Base Case
Financial Improvement
Difference
Focus areas
Transport Infrastructure - Capital
69,870
93,469
23,599
Increase to asset renewal needs, particular focus on resealing and resheeting
Transport Infrastructure - Operational
2,475
2,475
Increased maintenance grading and road drainage clearing
Flooding and Drainage - Capital
710
2,260
1,550
Replacement program enhanced with some expansion
Flooding and Drainage - Operational
450
450
Increased maintenance and cleaning activities
Community, Amenity and Recreation - Capital
1,369
3,141
1,772
Renewal program and addressing compliance concerns
Community, Amenity and Recreation - Operational
1,350
1,350
Additional mowing activities and building minor works
Plants and Depots
32,592
32,592
0
Total
104,541
135,737
31,196
Financial Stabilisation
Function
Base Case
Financial Stabilisation
Difference
Focus areas
Transport Infrastructure - Capital
69,870
106,012
36,142
Further increase to asset renewal needs, particular focus on resealing and resheeting to bridge gap
Transport Infrastructure - Operational
2,475
2,475
Increased maintenance grading and road drainage clearing (no increase from Scenario 2)
Flooding and Drainage - Capital
710
2,510
1,800
Replacement program enhanced with some expansion
Flooding and Drainage - Operational
450
450
Increased maintenance and cleaning activities (no increase from Scenario 2)
Community, Amenity and Recreation - Capital
1,369
3,969
2,600
Further increase to asset renewal needs to bridge gap for buildings and structures
Community, Amenity and Recreation - Operational
1,467
1,467
Additional mowing activities and building minor works
Plants and Depots
32,592
32,592
0
Total
104,541
149,475
44,934
Fully Sustainable
Function
Base Case
Fully Sustainable
Difference
Focus areas
Transport Infrastructure - Capital
69,870
120,174
50,304
Further increase to asset renewal needs, particular focus on resealing and resheeting to bridge gap
Transport Infrastructure - Operational
4,050
4,050
Increased maintenance grading and road drainage clearing (increase to scenario 3)
Flooding and Drainage - Capital
710
2,360
1,650
Replacement program enhanced with some expansion
Flooding and Drainage - Operational
900
900
Increased maintenance and cleaning activities (increase to scenario 3)
Community, Amenity and Recreation - Capital
1,369
5,119
3,750
Further increase to asset renewal needs to bridge gap for buildings and structures
Community, Amenity and Recreation - Operational
2,700
2,700
Additional mowing activities and building minor works (further increase to scenario 3)
Plants and Depots
32,592
32,592
0
Total
104,541
167,895
63,354
The base case represents a "continue as is approach", and as shown in the summary tables does not satisfy future renewal and operational needs to manage council's infrastructure. The funding gap, if not addressed, is highly likely to manifest problems in the long term with premature deterioration of assets, greater complexity and cost with repair/replacement of assets, availability and reliability of assets will decline for each of the asset functions.
Consideration of options to increase grant funding to these assets will be challenging given uncertainty of grant funding from state and federal governments. Historically, grant funding programs cannot always be relied upon to be available when required, nor be available for the purpose to which what is needed to address the asset renewal or operational needs of the organisation. Advocacy from local government representative groups continue to seek consistency in the availability of fit for requirements grant funding, however there no commitment of reform to funding arrangements to local government.
There are four options available for consideration of how council can address the gap as it has been presented:
- Accept the risk - which is to maintain the current course of action (the base case scenario)
- Undertake further analysis on the risks - further work to improve asset data is built into the improvement plan
- Allocate additional resources - consider the financial scenarios in the Long Term Financial Plan
- Reconsider objectives - Are the aspirations achievable and conversations with the community about what can be done
The four options do not have to be considered in isolation, and council may seek to work with all four in determining the next steps in its management of assets.This Strategic Asset Management Plan 2026-2036 (SAMP) sits alongside the Long Term Financial Plan (LTFP) in Council’s Resourcing Strategy. Its purpose is to communicate the implications of the current course of action (which is described as the base case scenario) and to explore alternative scenarios which involve investing more resources to reduce the risk.
This SAMP is best understood, as a key part of both Council’s Integrated Planning and Reporting (IP&R) and Risk Management (RM) Frameworks. It is a Risk Treatment Plan for Council’s infrastructure assets, although many of the activities to treat risk are unfunded in the base case scenario, which is why council is exploring alternatives.
Summary of our assets
Council manages an asset portfolio of $925.327M. The responsible and sustainable investment in these physical assets is crucial to the sound financial management of council's organisation itself but also, more broadly, for the benefit of our local communities.
Annually, the financial investment towards the management of this portfolio totals $22.685M operational and $28.317M capital expenditure, totalling $51.002M. This budgeted expenditure is utilised to deliver the objectives set in Council's Delivery Program, summarised as follows:
Function
Objective
Transport Infrastructure
Safe, smooth, accessible and efficient transport infrastructure
Flooding & Drainage
Floodplain and drainage infrastructure are managed for resilience and reliability
Community Amenity & Recreation
Well maintained community & recreational facilities that cater to our needs and make it a great place to live
Plant & Depots
Modern, reliable and efficient fleet and vehicles with functional works depots
Water Supply
A safe, secure and reliable water supply
Sewerage
A sufficient and reliable sewerage system that minimises environmental impacts
What does this SAMP do?
The SAMP provides a framework for prioritisation of the available resources to deliver the best possible value from all assets under council's control, with value understood in terms of realising the objectives in the Delivery Program. This value is achieved through consideration of risks that may prevent council from reaching its objectives, as well as the financial forecasts required to deliver the services into the future.
With a direct linkage to the Long Term Financial Plan, the SAMP forecasts on the current course of action where we will be in the long term. In the case where the SAMP indicates that council may not be in a position currently to deliver on its objectives in the long term, scenarios are modelled to demonstrate how a more sustainable management of assets may be achieved.
What does the SAMP tell us?
The draft Strategic Asset Management Plan (2026-2036) indicates that the following functions are at a high risk of council not meeting its objectives over the next ten years:
- Transport Infrastructure
- Flooding and Drainage
- Water Supply
- Sewerage
This assessment is primarily made on the basis that the funding needs for each of these functions is greater than the forecasted available funding within the long term financial plan, on a "continue as we are" scenario (base case). On the basis of this risk assessment, council would continue to prioritise the limited resources it had, but it is expected that a gap would emerge between what council was trying to achieve with the service, and the reality of a declining condition and thus performance of the assets.
To provide an indication of differing levels of asset management sustainability within council's general fund, three further scenarios have been explored within the SAMP:
Financial Improvement
Function
Base Case
Financial Improvement
Difference
Focus areas
Transport Infrastructure - Capital
69,870
93,469
23,599
Increase to asset renewal needs, particular focus on resealing and resheeting
Transport Infrastructure - Operational
2,475
2,475
Increased maintenance grading and road drainage clearing
Flooding and Drainage - Capital
710
2,260
1,550
Replacement program enhanced with some expansion
Flooding and Drainage - Operational
450
450
Increased maintenance and cleaning activities
Community, Amenity and Recreation - Capital
1,369
3,141
1,772
Renewal program and addressing compliance concerns
Community, Amenity and Recreation - Operational
1,350
1,350
Additional mowing activities and building minor works
Plants and Depots
32,592
32,592
0
Total
104,541
135,737
31,196
Financial Stabilisation
Function
Base Case
Financial Stabilisation
Difference
Focus areas
Transport Infrastructure - Capital
69,870
106,012
36,142
Further increase to asset renewal needs, particular focus on resealing and resheeting to bridge gap
Transport Infrastructure - Operational
2,475
2,475
Increased maintenance grading and road drainage clearing (no increase from Scenario 2)
Flooding and Drainage - Capital
710
2,510
1,800
Replacement program enhanced with some expansion
Flooding and Drainage - Operational
450
450
Increased maintenance and cleaning activities (no increase from Scenario 2)
Community, Amenity and Recreation - Capital
1,369
3,969
2,600
Further increase to asset renewal needs to bridge gap for buildings and structures
Community, Amenity and Recreation - Operational
1,467
1,467
Additional mowing activities and building minor works
Plants and Depots
32,592
32,592
0
Total
104,541
149,475
44,934
Fully Sustainable
Function
Base Case
Fully Sustainable
Difference
Focus areas
Transport Infrastructure - Capital
69,870
120,174
50,304
Further increase to asset renewal needs, particular focus on resealing and resheeting to bridge gap
Transport Infrastructure - Operational
4,050
4,050
Increased maintenance grading and road drainage clearing (increase to scenario 3)
Flooding and Drainage - Capital
710
2,360
1,650
Replacement program enhanced with some expansion
Flooding and Drainage - Operational
900
900
Increased maintenance and cleaning activities (increase to scenario 3)
Community, Amenity and Recreation - Capital
1,369
5,119
3,750
Further increase to asset renewal needs to bridge gap for buildings and structures
Community, Amenity and Recreation - Operational
2,700
2,700
Additional mowing activities and building minor works (further increase to scenario 3)
Plants and Depots
32,592
32,592
0
Total
104,541
167,895
63,354
The base case represents a "continue as is approach", and as shown in the summary tables does not satisfy future renewal and operational needs to manage council's infrastructure. The funding gap, if not addressed, is highly likely to manifest problems in the long term with premature deterioration of assets, greater complexity and cost with repair/replacement of assets, availability and reliability of assets will decline for each of the asset functions.
Consideration of options to increase grant funding to these assets will be challenging given uncertainty of grant funding from state and federal governments. Historically, grant funding programs cannot always be relied upon to be available when required, nor be available for the purpose to which what is needed to address the asset renewal or operational needs of the organisation. Advocacy from local government representative groups continue to seek consistency in the availability of fit for requirements grant funding, however there no commitment of reform to funding arrangements to local government.
There are four options available for consideration of how council can address the gap as it has been presented:
- Accept the risk - which is to maintain the current course of action (the base case scenario)
- Undertake further analysis on the risks - further work to improve asset data is built into the improvement plan
- Allocate additional resources - consider the financial scenarios in the Long Term Financial Plan
- Reconsider objectives - Are the aspirations achievable and conversations with the community about what can be done
The four options do not have to be considered in isolation, and council may seek to work with all four in determining the next steps in its management of assets. -
Assessing our Community's Capacity to Pay
Share Assessing our Community's Capacity to Pay on Facebook Share Assessing our Community's Capacity to Pay on X (formerly Twitter) Share Assessing our Community's Capacity to Pay on Linkedin Email Assessing our Community's Capacity to Pay linkThe Local Government Act 1993 requires councils to consider principles of equity, social justice and the financial impact of rates and charges on their communities. Capacity to Pay assessments are commonly used to support:
- Annual Operational Plan and Budget
- Long-term financial planning
- Rating structure reviews or harmonisation
- Applications for a Special Rate Variation (SRV)
Cabonne Council (Council) is reviewing its current rating structure to ensure rates are shared fairly and equitably across the community. To support this review, Council engaged a Morrison Low Advisory to undertake a capacity to pay analysis to gain an understanding of where there may be areas or groups of ratepayers that may be vulnerable to potential rating structure changes.
In addition, the capacity to pay analysis was undertaken to provide council with an early indicator of the relative capacity to pay within the Cabonne LGA. The analysis was based on the SRV scenarios in the 2025-2035 Long Term Financial Plan against council’s current rating subcategories.
Geographic Groupings
The Cabonne LGA was divided into four groupings for the analysis to ensure that equity is maintained between areas, as each grouping has slightly differing economic and socio-economic profiles.
A summary of the groupings and the localities that they encompass has been provided in the following table and figure:
Grouping
Population (2021)
Localities
East
2,376
Belgravia, Boomey, Byng, Clergate, Clifton Grove, Emu Swamp, Guyong, Kangaroobie, Kerrs Creek, Larras Lee, Lewis Ponds, Lower Lewis Ponds, March, Mullion Creek, Ophir, Summer Hill Creek
North
4,481
Amaroo, Baldry, Bocobra, Cumnock, Garra, Gumble, Manildra, Molong, Obley, Yeoval, Yullundry
South-Central
2,819
Cargo, Cadia, Waldegrave, Spring Terrace, Springside, Nashdale, Borenore, Canobolas, Four Mile Creek, Boree, Lidster, Bowan Park, Windera
West
4,061
Canowindra, Cudal, Eugowra, Mandagery, Moorbel, Murga, Nyrang Creek, Toogong
Cabonne Council LGA
13,766

The methodology in examining the relative wealth between the different groupings focused on the following:
- Areas of social disadvantage including the age structure of each region, the typical make up of each household, household income (including the effect of dependents), and Socio-Economic Indexes for Areas (SEIFA) rankings.
- Vulnerable groups of individuals including persons who have or need core assistance, individuals who are currently unemployed, households currently under housing stress, and pensioners.
- Patterns in household expenditure and the impacts they may have on an individual’s ability to pay.
- Employment by industry, as well as value-added industry sector and the key productive sectors.
The above findings were compared to the current average rates to determine whether there are any groups or individuals that may be impacted by possible rating changes.
Rating Category Impacts
Council rates represent a high proportion of disposable income for low and fixed-income households. Even incremental increases can have a disproportionate impact on vulnerable residents, including pensioners. Taking these factors into account, the preliminary Capacity to Pay Report indicates that there is an overall moderate to strong level of capacity within the LGA, with much of the analysis highlighting improved indicators compared to that of the Central West Region and Regional NSW, combined with relatively low residential rates.
Residential Rates
There is marked variation in residential financial sensitivity across the four geographic groupings. The North and West display lower levels of socio‑economic advantage and, consequently, a higher potential for vulnerability and financial stress, while the South‑Central and East groupings demonstrate significantly greater advantage and capacity. These differences are reflected in average land values and residential rates, meaning the impact of any rating increase is proportionately lower in the more disadvantaged areas and higher in the more advantaged groupings. This moderates the financial impact on households with lower capacity and, when combined with an effective financial hardship policy, suggests there is sufficient relative capacity across all groupings to apply a rating increase equitably across the LGA.
Business Rates
Average business rates across the LGA are comparatively low relative to similar and neighbouring councils, regardless of the SRV scenarios applied, indicating capacity for the business category to absorb additional increases.
Farmland Rates
While average farmland rates move towards the upper range of comparable councils under SRV scenarios 2 and 3, this is offset by a strong and positive agricultural outlook. Agriculture represents the largest contributor to economic output and value add within the LGA, underpinned by a high level of industry diversity, supporting the view that the farmland category has capacity to accommodate higher rates.
Mining Rates
Comparisons of average mining rates are less informative; however, given Cabonne’s key mine is one of Australia’s largest gold operations, alongside historically strong gold prices and forecasts of continued price growth, there is considered to be substantial capacity within the mining category to absorb increased rates.
Next Steps
Following a formal review of the distributive equity of Council’s current rating structure including rating sub-categories, further analysis will be undertaken to evaluate the general financial capacity of ratepayers against the revised rating structure. A final report will be provided to Council following completion of the analysis and review.
The Local Government Act 1993 requires councils to consider principles of equity, social justice and the financial impact of rates and charges on their communities. Capacity to Pay assessments are commonly used to support:
- Annual Operational Plan and Budget
- Long-term financial planning
- Rating structure reviews or harmonisation
- Applications for a Special Rate Variation (SRV)
Cabonne Council (Council) is reviewing its current rating structure to ensure rates are shared fairly and equitably across the community. To support this review, Council engaged a Morrison Low Advisory to undertake a capacity to pay analysis to gain an understanding of where there may be areas or groups of ratepayers that may be vulnerable to potential rating structure changes.
In addition, the capacity to pay analysis was undertaken to provide council with an early indicator of the relative capacity to pay within the Cabonne LGA. The analysis was based on the SRV scenarios in the 2025-2035 Long Term Financial Plan against council’s current rating subcategories.
Geographic Groupings
The Cabonne LGA was divided into four groupings for the analysis to ensure that equity is maintained between areas, as each grouping has slightly differing economic and socio-economic profiles.
A summary of the groupings and the localities that they encompass has been provided in the following table and figure:
Grouping
Population (2021)
Localities
East
2,376
Belgravia, Boomey, Byng, Clergate, Clifton Grove, Emu Swamp, Guyong, Kangaroobie, Kerrs Creek, Larras Lee, Lewis Ponds, Lower Lewis Ponds, March, Mullion Creek, Ophir, Summer Hill Creek
North
4,481
Amaroo, Baldry, Bocobra, Cumnock, Garra, Gumble, Manildra, Molong, Obley, Yeoval, Yullundry
South-Central
2,819
Cargo, Cadia, Waldegrave, Spring Terrace, Springside, Nashdale, Borenore, Canobolas, Four Mile Creek, Boree, Lidster, Bowan Park, Windera
West
4,061
Canowindra, Cudal, Eugowra, Mandagery, Moorbel, Murga, Nyrang Creek, Toogong
Cabonne Council LGA
13,766

The methodology in examining the relative wealth between the different groupings focused on the following:
- Areas of social disadvantage including the age structure of each region, the typical make up of each household, household income (including the effect of dependents), and Socio-Economic Indexes for Areas (SEIFA) rankings.
- Vulnerable groups of individuals including persons who have or need core assistance, individuals who are currently unemployed, households currently under housing stress, and pensioners.
- Patterns in household expenditure and the impacts they may have on an individual’s ability to pay.
- Employment by industry, as well as value-added industry sector and the key productive sectors.
The above findings were compared to the current average rates to determine whether there are any groups or individuals that may be impacted by possible rating changes.
Rating Category Impacts
Council rates represent a high proportion of disposable income for low and fixed-income households. Even incremental increases can have a disproportionate impact on vulnerable residents, including pensioners. Taking these factors into account, the preliminary Capacity to Pay Report indicates that there is an overall moderate to strong level of capacity within the LGA, with much of the analysis highlighting improved indicators compared to that of the Central West Region and Regional NSW, combined with relatively low residential rates.
Residential Rates
There is marked variation in residential financial sensitivity across the four geographic groupings. The North and West display lower levels of socio‑economic advantage and, consequently, a higher potential for vulnerability and financial stress, while the South‑Central and East groupings demonstrate significantly greater advantage and capacity. These differences are reflected in average land values and residential rates, meaning the impact of any rating increase is proportionately lower in the more disadvantaged areas and higher in the more advantaged groupings. This moderates the financial impact on households with lower capacity and, when combined with an effective financial hardship policy, suggests there is sufficient relative capacity across all groupings to apply a rating increase equitably across the LGA.
Business Rates
Average business rates across the LGA are comparatively low relative to similar and neighbouring councils, regardless of the SRV scenarios applied, indicating capacity for the business category to absorb additional increases.
Farmland Rates
While average farmland rates move towards the upper range of comparable councils under SRV scenarios 2 and 3, this is offset by a strong and positive agricultural outlook. Agriculture represents the largest contributor to economic output and value add within the LGA, underpinned by a high level of industry diversity, supporting the view that the farmland category has capacity to accommodate higher rates.
Mining Rates
Comparisons of average mining rates are less informative; however, given Cabonne’s key mine is one of Australia’s largest gold operations, alongside historically strong gold prices and forecasts of continued price growth, there is considered to be substantial capacity within the mining category to absorb increased rates.
Next Steps
Following a formal review of the distributive equity of Council’s current rating structure including rating sub-categories, further analysis will be undertaken to evaluate the general financial capacity of ratepayers against the revised rating structure. A final report will be provided to Council following completion of the analysis and review.
-
Future Ready Cabonne: Financial Sustainability Plan
Share Future Ready Cabonne: Financial Sustainability Plan on Facebook Share Future Ready Cabonne: Financial Sustainability Plan on X (formerly Twitter) Share Future Ready Cabonne: Financial Sustainability Plan on Linkedin Email Future Ready Cabonne: Financial Sustainability Plan linkIn line with the Office of Local Government’s (OLG) Special Rate Variation (SRV) Guidelines, council is required to clearly demonstrate the steps it has taken, and plans to take, to improve productivity and contain costs. The Guidelines stipulate that Council’s Integrated Planning and Reporting (IP&R) documents, or an SRV application, must explain and quantify the productivity improvements and cost containment strategies realised in previous years, as well as those proposed over the period of the special rate variation. This requirement ensures transparency and accountability and provides assurance to the community and the regulator that any additional revenue sought is justified and necessary.
To ensure alignment with the OLG’s SRV Guidelines and consideration of a structured and transparent approach to defining and achieving financial sustainability, a Financial Sustainability Plan has been developed.
Council’s Financial Sustainability Plan details the following strategies and activities that council has taken, and plans to take, to meet the following criterion in the OLG’s SV Guidelines:
- What is the council’s strategic approach to improving productivity in its operations and asset management?
- What outcomes has the council achieved from productivity improvements and cost containment strategies in past years?
- What productivity improvements and cost containment strategies are planned for future years?
- How has the council’s levels of productivity and efficiency changed over time, and compared to similar councils?
The development of the Financial Sustainability Plan enables council to articulate how ongoing efficiency measures are being applied across the organisation. These measures are considered in the context of continuous improvement and sound financial management, and their estimated financial impacts are incorporated into the Long Term Financial Plan. This approach ensures that efficiency gains are not treated in isolation, but form part of an integrated strategy to support council’s long‑term financial sustainability and service delivery objectives.
Council's Financial Sustainability Plan will be reviewed in twelve-months and, if council proceeds with an application to the NSW IPART in 2028, prior to the application submission.
In line with the Office of Local Government’s (OLG) Special Rate Variation (SRV) Guidelines, council is required to clearly demonstrate the steps it has taken, and plans to take, to improve productivity and contain costs. The Guidelines stipulate that Council’s Integrated Planning and Reporting (IP&R) documents, or an SRV application, must explain and quantify the productivity improvements and cost containment strategies realised in previous years, as well as those proposed over the period of the special rate variation. This requirement ensures transparency and accountability and provides assurance to the community and the regulator that any additional revenue sought is justified and necessary.
To ensure alignment with the OLG’s SRV Guidelines and consideration of a structured and transparent approach to defining and achieving financial sustainability, a Financial Sustainability Plan has been developed.
Council’s Financial Sustainability Plan details the following strategies and activities that council has taken, and plans to take, to meet the following criterion in the OLG’s SV Guidelines:
- What is the council’s strategic approach to improving productivity in its operations and asset management?
- What outcomes has the council achieved from productivity improvements and cost containment strategies in past years?
- What productivity improvements and cost containment strategies are planned for future years?
- How has the council’s levels of productivity and efficiency changed over time, and compared to similar councils?
The development of the Financial Sustainability Plan enables council to articulate how ongoing efficiency measures are being applied across the organisation. These measures are considered in the context of continuous improvement and sound financial management, and their estimated financial impacts are incorporated into the Long Term Financial Plan. This approach ensures that efficiency gains are not treated in isolation, but form part of an integrated strategy to support council’s long‑term financial sustainability and service delivery objectives.
Council's Financial Sustainability Plan will be reviewed in twelve-months and, if council proceeds with an application to the NSW IPART in 2028, prior to the application submission.
-
Cabonne Land Values Rise
Share Cabonne Land Values Rise on Facebook Share Cabonne Land Values Rise on X (formerly Twitter) Share Cabonne Land Values Rise on Linkedin Email Cabonne Land Values Rise linkLand values across Cabonne have surged by more than $1.1 billion, with new figures set to shape the council’s 2026/2027 rates.
The latest valuations issued by the Valuer General of New South Wales place the total land value of the Cabonne Local Government Area at $5.89 billion, up from $4.78 billion in 2022.
In NSW, councils use land values determined by the Valuer General to calculate annual rates. At Cabonne, each property’s land value is multiplied by the council’s rate-in-the-dollar, known as the ad valorem rate, to determine its share of rates. A minimum rate ensures every property contributes a base amount.
While overall rates revenue is capped by the Independent Pricing and Regulatory Tribunal of New South Wales (IPART), changes in land values can shift how the total burden is shared between property owners.
The new valuations, issued at the end of 2025, will be used to model rates notices for the 2026/2027 financial year. Landholders should have received their Notice of Valuation in late February/early March 2026.
Property owners who disagree with their valuation have 60 days from the notice date to lodge an objection through the NSW Valuation and Objection Portal.Land values across Cabonne have surged by more than $1.1 billion, with new figures set to shape the council’s 2026/2027 rates.
The latest valuations issued by the Valuer General of New South Wales place the total land value of the Cabonne Local Government Area at $5.89 billion, up from $4.78 billion in 2022.
In NSW, councils use land values determined by the Valuer General to calculate annual rates. At Cabonne, each property’s land value is multiplied by the council’s rate-in-the-dollar, known as the ad valorem rate, to determine its share of rates. A minimum rate ensures every property contributes a base amount.
While overall rates revenue is capped by the Independent Pricing and Regulatory Tribunal of New South Wales (IPART), changes in land values can shift how the total burden is shared between property owners.
The new valuations, issued at the end of 2025, will be used to model rates notices for the 2026/2027 financial year. Landholders should have received their Notice of Valuation in late February/early March 2026.
Property owners who disagree with their valuation have 60 days from the notice date to lodge an objection through the NSW Valuation and Objection Portal.
Integrated Planning & Reporting documents
-
Delivery Program 2025-2029 (revised 2026) (31.7 MB) (pdf)
-
Operational Plan 2026-2027 (51.7 MB) (pdf)
-
Resourcing Strategy Part 1 - Strategic Asset Management Plan 2026-2036 (12.7 MB) (pdf)
-
Resourcing Strategy Part 2 - Strategic Service Management Plans 2026-2036 (53.4 MB) (pdf)
-
Resourcing Strategy Part 3 - Long Term Financial Plan 2026-2036 (8.61 MB) (pdf)
-
Fees and Charges Report 2026-2027 (4.96 MB) (pdf)
-
Future Ready Cabonne - Financial Sustainability Plan (23.2 MB) (pdf)
Increasing the Understanding: FAQs and Information Sheets
-
Frequently Asked Questions - Future Ready Cabonne (2.98 MB) (pdf)
-
Information Sheet - Future Ready Cabonne (3.43 MB) (pdf)
-
Information Sheet - Long Term Financial Plan 2026-2036 (1.43 MB) (pdf)
-
Information Sheet - Review of Councils Rating System (1.38 MB) (pdf)
-
Information Sheet - Capacity to Pay (365 KB) (pdf)
-
Information Sheet - Financial Sustainability Plan (353 KB) (pdf)
-
Information Sheet - 2026-2027 Budget (1.05 MB) (pdf)
-
Information Sheet - Strategic Asset Management Plan (2.07 MB) (pdf)
Timeline
-
28 April 2026
Future Ready Cabonne: Increasing the Understanding has finished this stageIntegrated Planning and Reporting 2026-27 documentation considered by council at its Ordinary Council Meeting.
-
29 April - 26 May 2026
Future Ready Cabonne: Increasing the Understanding has finished this stagePublic exhibition period for the Integrated Planning and Reporting 2026-27 documents.
Submissions can be submitted online via Have Your Say, via email or in writing to the General Manager.
-
23 June 2026
Future Ready Cabonne: Increasing the Understanding has finished this stage- No submissions were received for the Integrated Planning and Reporting Documentation 2026-27.
- Integrated Planning and Reporting 2026-27 documents were considered and adopted by Council.
-
July 2026 - Community Survey
Future Ready Cabonne: Increasing the Understanding is currently at this stageA community survey has been released to provide Council with deeper insights into community priorities, needs and satisfaction.
-
Spring Engagement
this is an upcoming stage for Future Ready Cabonne: Increasing the UnderstandingStay tuned for some key dates for council's spring engagement tour, where staff will be stationed at the annual agricultural shows and the Australian National Field Days. There's also plans for community consultation events in October. Dates will be released closer to October.
Further engagement opportunities
-
September 2026
Who's Listening
-
General Manager